MONTREAL (AP) — In an industrial suburb of Montreal, sheets of copper move along a conveyor belt suspended four stories above the floor of a foundry — a metals plant — until they drop into a lava-hot furnace. Next come pieces of discarded copper wire.
Out of the furnace comes liquid copper, alight with green fire. It travels to a second furnace and from there, a river of orange copper flows out, to be shaped into copper rods, the raw material for copper wire.
This Nexans mill has made copper rod from ore for nearly a century. But now it also makes an increasing amount of it from used copper, with the rods containing some 14% recycled metal. It hopes to get to 20%.
“We say to our customers: Your waste of today, your scrap of today is your energy of tomorrow, so bring back your scrap,” said Nexans CEO Christopher Guérin.
Across the industry, manufacturers have been reusing and recycling some degree of copper for many years. Now they’re stepping up these efforts as the need for the metal is projected to nearly double by 2035.
It’s partly due to a move away from fossil fuels to cut planet-warming greenhouse gas emissions. There’s a growing movement to power buildings, vehicles and manufacturing operations with clean electricity, to “electrify everything” — which uses more copper.
Building construction, cell phones and data centers account for the other half of the increase in demand.
Every ton of copper that is recycled means some 200 tons of rock that won’t need to be mined, though the amount depends on how rich the ore is. That’s important because mining can cause erosion, contaminate soil and water, threaten local biodiversity and pollute the air. Copper is an especially good candidate for reuse, because it can be recycled indefinitely without losing its value or performance, Guérin said.
Daily, up to 10 trucks drop off bare wire, cable and copper scrap at the Nexans mill. Some comes from customers, some from scrap dealers. The purity must be high if it’s to be used to conduct electricity. One of the world’s largest wire and cable manufacturers, Nexans uses more than 2,600 times the weight of the Statue of Liberty in copper each year.
People may have a closer connection to this metal and this mill than they realize — copper connects them to the world, said Daniel Yergin, an expert on energy and vice chairman of the analytics firm S&P Global.
“We depend on electricity for everything now,” he said. “None of it works without copper.”
Aluminum is used in electrical wiring too, but it takes a lot of energy to produce. Some aluminum smelters, where machines separate metal from ore, have cut production or closed as electricity prices have increased, adding to the demand for copper.
Roughly two-thirds of all the copper produced in the last century is still in use, mostly for electrical grids, home appliances and communications, according to the International Copper Association. When those get past their useful life, they are an enormous stock that can be recycled in the future, the ICA said.
Colin Williams, program coordinator for the USGS Mineral Resources Program, said companies should recycle more of the copper that is already out there, taking advantage of what is, effectively, the “urban mine.”
“It increases the supply available,” he said. “… It reduces the energy and environmental impacts associated with new mining by being able to reuse material we’ve already mined. It’s an important step.”
___
The Associated Press’ climate and environmental coverage receives financial support from multiple private foundations. AP is solely responsible for all content. Find AP’s standards for working with philanthropies, a list of supporters and funded coverage areas at AP.org.
Poaching, habitat destruction, and climate change have decimated wild African elephant populations and pushed the animals into endangered-species territory. An international project called Operation Frozen Dumbo aims to bolster elephant populations in the wild and in the world’s zoos.
Above a herd of elephants in the Selati Game Reserve in South Africa, helicopter pilot Jana Meyer and wildlife veterinarian Hayden Cuthill scan the bush for the most worthy-looking bull elephant. Once their target is selected, Ms. Meyer deftly maneuvers her aircraft to separate the animal from the herd. Dr. Cuthill quickly estimates the male’s weight and prepares the tranquilizer dose. He fixes the ampul atop a special dart, which he shoots directly into the male’s left flank.
Why We Wrote This
At their best, zoos inspire a conservation mind-set among visitors. But many European facilities populate exhibits with elephants taken from the wild. One international project offers an alternative.
A team on the ground will collect the elephant’s sperm as part of the Frozen Dumbo project. The samples collected in the wild are cryogenically frozen and shipped to a consortium of European zoos, which use them to artificially inseminate their females.
Thomas Hildebrandt of the Leibniz Institute for Zoo and Wildlife Research, who has overseen the successful artificial insemination of more than 50 female elephants, is passionate about his goal: “We have to stop populating the European zoos with animals from the wild.”
Above a herd of elephants in the Selati Game Reserve in South Africa, helicopter pilot Jana Meyer and wildlife veterinarian Hayden Cuthill scan the bush for the most worthy-looking bull elephant.
Once their target is selected, Ms. Meyer deftly maneuvers her aircraft to separate the animal from the herd. Dr. Cuthill quickly estimates the male’s weight and prepares the tranquilizer dose. He fixes the ampul atop a special dart, which he shoots directly into the male’s left flank.
A team on the ground will collect the elephant’s sperm as part of an ongoing international effort to improve elephant fertility, a project called Operation Frozen Dumbo. The samples collected in the wild are cryogenically frozen and shipped to a consortium of European zoos, which use them to artificially inseminate their females.
Why We Wrote This
At their best, zoos inspire a conservation mind-set among visitors. But many European facilities populate exhibits with elephants taken from the wild. One international project offers an alternative.
This avoids the importation of wild elephants.
Factors such as poaching, habitat destruction, and climate change have decimated wild African elephant populations and pushed the animals into endangered-species territory. The Frozen Dumbo project aims to bolster elephant populations in the wild and in the world’s zoos.
Back at Selati, the sedated male – dubbed The Sperminator – issues a series of loud grunts. A volunteer keeps the tip of his trunk dilated with a wooden stick to ensure the animal’s breathing.
Elephants draw air exclusively through their trunks, so if anything blocks this double-channel pathway, the animal could quickly die. Elephants cannot breathe through their mouths like other land mammals – a trait inherited from their aquatic ancestors.
This is the fifth day of the Selati sperm-collecting expedition, which has been largely unsuccessful.
Everyone on the team is relieved when an ultrasound performed by the project’s lead scientist, Thomas Hildebrandt of the Leibniz Institute for Zoo and Wildlife Research, shows the animal’s reproductive potential to be high. His semen is extracted into vials that will then be flown by helicopter to a field lab to be gradually frozen. These will be shipped to a cryobank at ZooParc de Beauval in France.
Dr. Hildebrandt, who has overseen the successful artificial insemination of more than 50 female elephants, is passionate about his goal: “We have to stop populating the European zoos with animals from the wild,” he says. “Instead, we only need to import the sperm and the egg cells.”
Thomas Hildebrandt (left) and Miguel Casares, a veterinarian at Bioparc Valencia, prepare to collect an elephant’s semen.
Dr. Hildebrandt and Frank Göritz (right), both of the Leibniz Institute for Zoo and Wildlife Research in Berlin, perform an ultrasound on an elephant to gauge the amount of his sperm.
Veterinarian Hayden Cuthill prepares to shoot a tranquilizer dart into a male elephant below, in Selati Game Reserve in South Africa.
Sperm is stored in nitrogen tanks at minus 196 C (minus 320 F) and is ready to be shipped to European zoos.
Dr. Hildebrandt analyzes a thawed sperm sample before injecting it into an elephant cow at Bioparc Valencia.
Scientists and conservationists collect samples for the Frozen Dumbo project’s cryo sperm bank.
Miri, shown here at Bioparc Valencia, was born through artificial insemination.
A new study from GNS Science marks a significant step in the assessment of environmental contamination in Aotearoa New Zealand’s capital.
The Urban Geochemical Atlas of Wellington provides the first baseline of the concentrations of elements in the near-surface soils of the Wellington region, highlighting where human activities have increased levels of heavy metals and other elements.
Researchers from GNS Science have measured the concentrations of 65 different elements in the soils across the Wellington region, excluding most of the Wairarapa and Kāpiti Coast.
Soil samples were taken from more than 150 sites for the study, from a mixture of public and privately-owned land. The results are presented in a series of maps. They can be used to help identify potential localized health and environmental impacts of contaminants, and to target mitigation and remediation efforts.
Several of the elements included in the atlas are metals that, in certain concentrations, can be hazardous to human health, including arsenic, cadmium, chromium, copper, mercury, nickel, lead, and zinc.
The occurrence of these metals in the soils across the country typically varies due to differences in underlying rock types, environmental conditions and human influence. However, Regine Morgenstern, GNS Science geologist, says that as the geology in the study region is relatively uniform, it’s not a significant factor influencing the elevated levels of these heavy metals found in some Wellington soils.
“The data reveals human influences on soil chemistry across the area, and this can also be clearly seen in the maps. For example, the map for lead shows the highest concentrations across much of the more densely developed areas, particularly around Wellington Harbor and the Hutt Valley, where a lot of old housing stock exists.”
Morgenstern says that it is not unexpected to find elevated levels of heavy metals in highly populated areas.
“This is common in cities worldwide, with possible sources including pollution from industrial processes, leaded petrol from our past, disposal of fossil fuel residues and household waste, and the deterioration and removal of lead-containing paints from older houses.”
The Ministry for the Environment (MfE) issues New Zealand’s soil contaminant standards for health. The standards set out the acceptable concentrations of heavy metals in soil, categorized by land use, with the most restrictive category assigned for rural residential or lifestyle blocks.
The study found some sample sites that exceeded the most restrictive thresholds for arsenic, lead and cadmium, with several samples exceeding standards set for high-density residential land use. Median lead values in Wellington soil are significantly higher than those found in New Zealand soils in general, but are below median values observed in urban soils in Dunedin City.
The sample spacings and interpolation technique used to construct the maps provides relatively low spatial resolution, but offers a good guide for where more detailed study at higher spatial resolution may be warranted.
Morgenstern said that although residents may be concerned if they learn their home is located within an area shown in the atlas to have elevated heavy metals, the maps cannot be used to pinpoint element concentrations for individual properties.
“We know that even within one property, concentrations can vary. Lead levels might be higher closer to a house where there has been an accumulation from leaded paint, and then lower in the vegetable garden. The estimated element concentrations are indicative only and how representative the estimates are for any site can only be confirmed with further sampling and analysis.”
Anyone interested in finding out more about the levels of heavy metals in their backyard can send a sample to the free soil-testing service Soilsafe Aotearoa. GNS Science helped to establish this service, which is run by the University of Auckland.
The atlas is the latest publication in GNS Science’s ongoing work mapping geochemical soil variation across Aotearoa New Zealand. It follows the recent release of a national atlas, and other localized studies including Dunedin and Auckland cities, Southland, Nelson-Marlborough and Otago.
GNS Science Environment and Climate Theme Leader, Giuseppe Cortese says these studies are an important addition to the wider work that GNS Science undertakes to quantify the contaminants present in our air, freshwater, ocean and soil, and to understand how these contaminants move through our environment.
“It can be confronting to see the impact that human settlement and urbanization has had on Wellington’s soils, and the heavy metals that have accumulated as a result of our activities. The atlas provides important information about the location and concentration of key elements so that we can monitor them, apply remediation measures if necessary, and manage their movement today.”
“The data also offers a starting point from which we can explore and model how these elements may move through our environment in the future. This is particularly important in the Wellington area where projected population increases will result in further urban densification,” says Cortese.
Citation:
Maps of heavy metals in Wellington, New Zealand soils show impacts of urbanization (2024, June 9)
retrieved 9 June 2024
from https://phys.org/news/2024-06-heavy-metals-wellington-zealand-soils.html
This document is subject to copyright. Apart from any fair dealing for the purpose of private study or research, no
part may be reproduced without the written permission. The content is provided for information purposes only.
For the first time since 1972 a spacecraft launched from the U.S. has landed softly on the surface of the moon. And, for the first time ever, this successful extraterrestrial landing was achieved by a spacecraft built and operated by private industry rather than by a government space program.
At 6:23 P.M. EST a 14.1-foot-tall lander resembling a police booth on stilts descended to the moon’s surface on a ballooning blue flame of rocket exhaust. Seconds later, the lander’s six feet crunched into the dark soil of Malapert A, a crater nestled deep in the moon’s southern latitudes.
This robotic voyager, aptly nicknamed Odysseus, carries six scientific payloads on behalf of NASA. But crucially, the U.S. space agency isn’t running the mission: Odysseus is the first commercial spacecraft ever to land safely on another celestial body.
On supporting science journalism
If you’re enjoying this article, consider supporting our award-winning journalism by subscribing. By purchasing a subscription you are helping to ensure the future of impactful stories about the discoveries and ideas shaping our world today.
And like its namesake from the ancient Greek epics, Odysseus faced trials as it sailed toward the lunar surface. Mere hours before landing, two onboard ranging lasers that Odysseus had planned to use to detect the moon’s surface broke. In response, Intuitive Machines improvised a software patch that let Odysseus commandeer two lasers onboard an experimental navigation payload built by NASA.
For more than 15 minutes after touchdown, Intuitive Machines’ mission control in Houston, Texas, waited in tense silence, as flight controllers attempted to establish contact with Odysseus. “Signs of life—we have a return signal we’re tracking,” quipped Tim Crain, Intuitive Machines’ chief technology officer IM-1 mission director. “We’re also not dead yet.”
Minutes later, Crain confirmed that Odysseus was transmitting from the moon’s surface, albeit weakly. At press, the reason for the signal’s weakness remains unclear.
IM-1 is the first U.S. mission to touch down softly on the lunar surface since Apollo 17 in 1972. And unlike IM-1, Apollo 17 was crewed. The nation’s last robotic soft landing on the moon took place in January 1968, with the touchdown of the NASA lander Surveyor 7.
“Odysseus has taken the moon,” NASA administrator Bill Nelson said in a pre-recorded congratulatory message. “This feat is a giant leap forward for all of humanity.”
The mission also achieves some technical firsts. The spacecraft’s main engine—which burns liquid methane and liquid oxygen—is the first of its kind to be used in a moon landing. IM-1 also marks the southernmost moon landing ever completed. The lunar lander of India’s Chandrayaan-3 mission, the first in this general region, touched down at 69 degrees south latitude, which on Earth would be like landing on the Antarctic Peninsula. IM-1, however, is sitting at more than 80 degrees south latitude—the lunar equivalent of the deep Antarctic interior.
IM-1’s onboard NASA instruments will provide the first in situ measurements of this forbidding environment, where the sun’s extreme angle on the horizon can create huge swings in surface temperatures, as well as in exposure to the “solar wind” of charged particles that are continuously belched out by our star. These data will include crucial radio measurements that will capture some of the solar wind’s interactions with the moon’s surface.
NASA is targeting the lunar south pole because some shadow-cloaked regions there contain water ice—a key resource for long-term human sojourns on the moon. For the agency’s Artemis III mission, which will launch no sooner than 2026, NASA has contracted with SpaceX to land a two-person crew near the lunar south pole.
“[IM-1] is a tech demo, if you like, but it will get our first data about the environment of the south pole of the moon. That’s going to be critical for designing systems to allow humans to survive and thrive there,” says University of Notre Dame lunar scientist Clive Neal.
Perhaps IM-1’s biggest contribution is the precedent it sets for the future of space exploration. For decades, space had been considered the purview of only a handful of government agencies. But thanks to plummeting launch costs and the steady march of technological progress, it’s now cheaper than ever for countries and private companies to build and operate spacecraft—and even send them to interplanetary destinations.
“[IM-1 is] a watershed in commercial development within the United States,” Neal says.
High Risk, High Reward
At 1:05 A.M. EST on February 15 IM-1 launched atop one of SpaceX’s Falcon 9 rockets from NASA’s Kennedy Space Center in Florida. Over the next several days, Odysseus traveled a total of more than one million kilometers (621,000 miles) to insert itself into lunar orbit, which it successfully did on February 21. The spacecraft is expected to operate on the moon’s surface for up to seven days before it succumbs to the darkness and brutal cold of lunar night.
The mission is flying under the banner of NASA’s Commercial Lunar Payload Services (CLPS) initiative, which has encouraged private investment in lunar missions since its founding in 2018. Under CLPS, the agency awards private companies contracts to deliver NASA equipment and science instruments to the moon’s surface. So far 14 companies have joined the program, which promises to pay up to $2.6 billion for delivery services through 2028.
Unlike traditional NASA programs, the space agency doesn’t own and operate CLPS spacecraft—the companies do. In return, NASA hopes to achieve lower costs and a higher cadence of missions. To date, NASA has paid Intuitive Machines $118 million under the contract that created IM-1—far less than the agency has spent on robotic landers in the past. And IM-1 is the second of up to five CLPS missions that may end up launching this year.
That said, CLPS companies have been given a steep hill to climb. Historically, only five out of every nine moon missions have succeeded, even among those of well-funded government space agencies. In August 2023 the Russian moon mission Luna-25 crashed into the lunar surface after an engine misfire. In January a Japanese lunar lander known as SLIM (Smart Lander for Investigating Moon) touched down safely but at an unexpected angle, which limited its ability to collect solar power.
And in exchange for lower costs and more missions, NASA took on a higher risk that any one CLPS mission would fail. From CLPS’s inception, NASA officials cautioned that even a 50 percent mission success rate was acceptable for the program.
So far that prediction is panning out. Back in January the Pittsburgh-based company Astrobotic attempted the first mission under CLPS, Peregrine Mission 1. Soon after launch, however, Astrobotic’s Peregrine spacecraft sprang a propellant leak. The company managed to keep the lander alive in space for a week and a half, but the mission ended with Peregrine burning up in Earth’s atmosphere.
“[NASA] expected an approximately 50 percent failure rate, and one for two is that rate,” says Laura Forczyk, executive director of the space industry consulting firm Astralytical. “[IM-1 proves] that there is a capability for commercial landers to safely land on the surface of the moon at a lower cost.”
Peregrine and IM-1 are just the first in an upcoming wave of commercial moon missions with increasingly ambitious goals. As soon as later this year, Astrobotic is on tap to deliver VIPER (Volatiles Investigating Polar Exploration Rover), a water-hunting rover built by NASA, to the lunar south pole. Intuitive Machines’ upcoming IM-2 mission, also slated for later this year, will deliver PRIME-1 (Polar Resources Ice Mining Experiment 1), a NASA drill designed to dig into the moon’s subsurface.
“These initial missions are more test missions,” Forczyk says. “We want to make sure that the technology is proven and mature before we put higher-stakes payloads onboard.”
The following is a statement from NASA Administrator Bill Nelson on the passing of Apollo astronaut Maj. Gen. (ret.) William “Bill” Anders, who passed away June 7, in San Juan Islands, Washington state, at the age of 90.
“In 1968, as a member of the Apollo 8 crew, as one of the first three people to travel beyond the reach of our Earth and orbit the Moon, Bill Anders gave to humanity among the deepest of gifts an explorer and an astronaut can give. Along with the Apollo 8 crew, Bill was the first to show us, through looking back at the Earth from the threshold of the Moon, that stunning image – the first of its kind – of the Earth suspended in space, illuminated in light and hidden in darkness: the Earthrise.
“As Bill put it so well after the conclusion of the Apollo 8 mission, ‘We came all this way to explore the Moon, and the most important thing is that we discovered the Earth.’
“That is what Bill embodied – the notion that we go to space to learn the secrets of the universe yet in the process learn about something else: ourselves. He embodied the lessons and the purpose of exploration.
“The voyage Bill took in 1968 was only one of the many remarkable chapters in Bill’s life and service to humanity. In his 26 years of service to our country, Bill was many things – U.S. Air Force officer, astronaut, engineer, ambassador, advisor, and much more.
“Bill began his career as an Air Force pilot and, in 1964, was selected to join NASA’s astronaut corps, serving as backup pilot for the Gemini XI and Apollo 11 flights, and lunar module pilot for Apollo 8.
“He not only saw new things but inspired generation upon generation to see new possibilities and new dreams – to voyage on Earth, in space, and in the skies. When America returns astronauts to the Moon under the Artemis campaign, and ultimately ventures onward to Mars, we will carry the memory and legacy of Bill with us.
“At every step of Bill’s life was the iron will of a pioneer, the grand passion of a visionary, the cool skill of a pilot, and the heart of an adventurer who explored on behalf of all of us. His impact will live on through the generations. All of NASA, and all of those who look up into the twinkling heavens and see grand new possibilities of dazzling new dreams, will miss a great hero who has passed on: Bill Anders.”
For more information about Anders’ NASA career, and his agency biography, visit:
This fossilized Buronius tooth is roughly a third of an inch long. Berthold Steinhilber / University of Tübingen
If great apes are known for anything, it’s being great in size. A large gorilla can weigh nearly 500 pounds, for example, and the extinct great ape Gigantopithecus was likely a hundred pounds or so heavier, the largest primate of all time. But now paleontologists have identified what might be the smallest of the great apes, a primate that lived in the forests of prehistoric Germany and was the size of a small dog.
Scientists have uncovered the fossils of two teeth and a kneecap that they say represent a new primate, named Buronius manfredschmidi. Paltry as that may seem, the teeth of fossilized mammals are often very distinctive and allow researchers to set species apart from each other. In this case, University of Tübingen paleoanthropologist Madelaine Böhme and colleagues propose, Buronius was a previously unknown species of hominid, or great ape, that lived in warm forests about 11.6 million years ago. The researchers described the fossils on Friday in PLOS One.
The first fossils of the ancient ape were uncovered more than a decade ago. In 2011, Böhme recalls, researchers began searching for fossils at a site called Hammerschmiede in southern Germany. “In the very first year,” she says, “we discovered the upper molar and the kneecap of Buronius right next to each other.”
Böhme and co-authors were confident the initial finds were from a primate, but they didn’t immediately know what sort. “Due to their small size, we initially thought they were pliopithecines,” Böhme says. Pliopithecines were prehistoric monkeys that spread through Eurasia during the Miocene, between 5.3 million and 23 million years ago, and some were quite small. The first tooth and the small bone could have come from such a primate, but too little had yet been uncovered for the researchers to be sure. The fossils waited for additional finds to place them in context.
The identity of Buronius didn’t come into focus until the researchers found the fossils of another ape at the same site. In 2015, Böhme and colleagues found the fossils of a hominid the researchers would eventually name Danuvius guggenmosi. Based on the available fossils, the researchers estimated that Danuvius could get to be about 68 pounds and was a much larger animal than the creature represented by the tooth and kneecap.
Studying the teeth of Danuvius led the researchers to reassess the 2011 finds, and a second mystery tooth had also been found in 2017. The fossils represented an additional ape, Buronius, that would have weighed about 22 pounds in life. “Now published, Buronius is the smallest known hominid,” Böhme says.
Madelaine Böhme holds 3D prints that she says represent Buronius and Danuvius molars.
Berthold Steinhilber / University of Tübingen
But other researchers aren’t entirely sure that Buronius and Danuvius are different species. The fossilized kneecap is small, but it could have come from a juvenile or a different sex of Danuvius, says Brooklyn College paleoanthropologist Kelsey Pugh, who was not involved in the new study. Both modern and extinct apes could greatly vary in size between sexes, she says, and so the small size of the kneecap is not enough to tell what primate species it belonged to.
With the kneecap posing questions, dental details are what principally distinguish the larger and smaller apes. The new study says that the size difference between the Buronius and Danuvius molars are greater than in any one species within the broader group of primates to which apes belong. The significant size disparity adds some support to the case that the molar found in 2011 and the Danuvius fossils represent different species.
In addition to the size difference between the molars, the interior details also distinguish the new tooth from that of Danuvius. The enamel of the Buronius molar is much thinner than that of a comparable Danuvius molar, hinting that the smaller ape was feeding on softer foods, like leaves, than its larger relative. “While enamel thickness is quite variable in living hominoids, the two Danuvius molars are quite distinct in this feature, reasonably indicating a difference in diet,” Pugh says.
These 3D prints of the two molars are magnified by a factor of ten. The enamel of the likely Buronius manfredschmidi tooth (left) is very thin, indicating it was an herbivore. The thick enamel of the likely Danuvius guggenmosi tooth (right) suggests it was an omnivore.
Berthold Steinhilber / University of Tübingen
The dietary difference hints at what vegetation grew in the Miocene habitat where the apes dwelled. Back when Buronius and Danuvius were alive, what’s now Bavaria was a flat, swampy landscape at the foot of the ancient Alps. The immediate area the fossils were preserved in hosted a meandering stream, Böhme says, surrounded by scrubby plants that grew densely along the banks. And even though the global climate was warmer than today, the area was far enough to the north that there would have been changes through the seasons, the fresh leaves of the spring and summer becoming rarer as the short autumn and winter days set in. How the apes foraged must have changed as the seasons affected how the local plants grew.
Selecting different foods would have allowed the apes of Hammerschmiede to coexist. “There are lots of examples of modern ecosystems where large numbers of primate species manage to coexist,” says University of Toronto Scarborough paleontologist Mary Silcox, who was not involved in the new study. The Kibale forest of Uganda, she notes, is home to 14 overlapping primate species, ranging from bush babies to monkeys and apes like chimpanzees. “Primates are very good at partitioning niche space,” she says, and the fossil record indicates that monkeys, apes and their relatives have been finding ways to coexist in the same forests for tens of millions of years.
Part of what allows multiple monkey and ape species to coexist today is that many live in warm equatorial forests where food is available year-round. The situation at Hammerschmiede is different, showing the resourcefulness of the apes found there. The vegetation where Buronius and Danuvius lived had deciduous trees and changed through the year. “It speaks to the productivity of the Hammerschmiede paleo-ecosystems that they allowed two great apes to coexist despite the seasonal food scarcity,” Böhme says.
The details of that coexistence await more fossils that will allow paleontologists to get a better view at what Hammerschmiede’s apes were like in life. More skeletal pieces will help sort out the relationships of the site’s apes, as well, which in turn will help paleoprimatologists understand how the prehistoric apes lived in a place quite different from the habitats of nonhuman apes today. Despite differences in interpretation, Pugh says, “it takes a lot of work to discover new fossils, and these authors have done an incredible job discovering new ape fossils at Hammerschmiede.” With luck, even more fossils will soon bring these ancient relatives of ours into clearer view.
In a recent interview for the web series Hot Ones, where guests answer tough questions while eating super-spicy chicken wings, pro basketball superstar Stephen Curry was asked about a sports psychology study from the 1980s. The subject of the study was the “hot hand effect,” the idea that players’ successes come in streaks—dependent on some mysterious inner quality that ebbs and flows—and when a player’s hand is hottest and they’re “in the zone,” it can feel almost like they can’t miss.
Curry knows a thing or two about a hot hand. He holds the NBA record for making at least one three-pointer in 268 consecutive games. Following a practice one day, he sank 105 three-pointers in a row. In the Hot Ones interview, Curry said the authors of the study “don’t know what they’re talking about at all.” When Curry totaled 60 points in one game, he said, “It’s literally a tangible, physical sensation of all I need is to get this ball off my fingertips and it’s going to go in.”
The study, “The Hot Hand in Basketball: On the Misperception of Random Sequences,” was written in 1985 by eminent psychologists Thomas Gilovich, Robert Vallone, and Amos Tversky. They allegedly demonstrated through an analysis of basketball shooting data that the hot hand was a myth. Recently deceased Nobel laureate (and Tversky’s chief collaborator) Daniel Kahneman proclaimed, “The hot hand is a massive and widespread cognitive illusion.” In statistical circles, the hot hand study has taken on a metaphorical significance beyond basketball. For decades, the fallacy of the hot hand has been cited to show that folktales of luck and streakiness are no match for cold, hard numbers.
However, the numbers do not prove the hot hand is a figment of imagination. Economists Joshua Miller of the University of Melbourne and Adam Sanjurjo at the University of Alicante in Spain, used data from multiple different sports, including the same basketball data used by Gilovich, Vallone, and Tversky, to provide robust support for a hot hand. The problem, say Miller and Sanjurjo, lies in the way the original authors analyzed their data and, in particular, a mistake they made about what random data should look like without the influence of a hot hand.
The mistake is this: Imagine we’re looking at a chart of hits and misses over some number of shots and trying to find where a shooter might have had a hot hand. Suppose we look for hot-handedness by considering only those attempts that came after a sequence of hits, such as three baskets in a row. These sequences are candidates for being shot with a “hot hand.”
Shouldn’t years of testimony from athletes like Stephen Curry count for something?
However, if there’s no such thing as a hot hand, we might expect the player to have the same success rate in these attempts—the shots after three consecutive makes—as their overall average. Since our working theory is that the previous successes have no predictive power for the next shot, it would seem intuitive that our choice of shots based on what happened right before the hot streak shouldn’t matter at all.
But that’s wrong. By selecting attempts that come after a hot streak and computing a proportion over this subset, we have unwittingly introduced a negative bias into the estimate of the rate of success that could counteract a hot-hand-induced positive effect. In other words, the observed percentage of success-following-success being equal to the rate of success-following-anything, would be evidence for the hot hand instead of against it. The way we selected the data artificially penalized the shooter; their true success rate may have been a few percentage points higher than what we tabulated. So, if our observation matched their usual average, it must be that something else was at work to offset our bias—a hot hand.
If you find yourself doubting this bias exists, you’re in good company, including the esteemed professors who first “debunked” the hot hand. Like other famously counterintuitive examples in probability, such as the Monty Hall Problem—the puzzle of whether to switch doors when searching for a prize on the game show Let’s Make a Deal—the phenomenon acts almost like an optical illusion: Our natural senses tell us something that turns out to be contradicted when we try to confirm it with hard measurement.
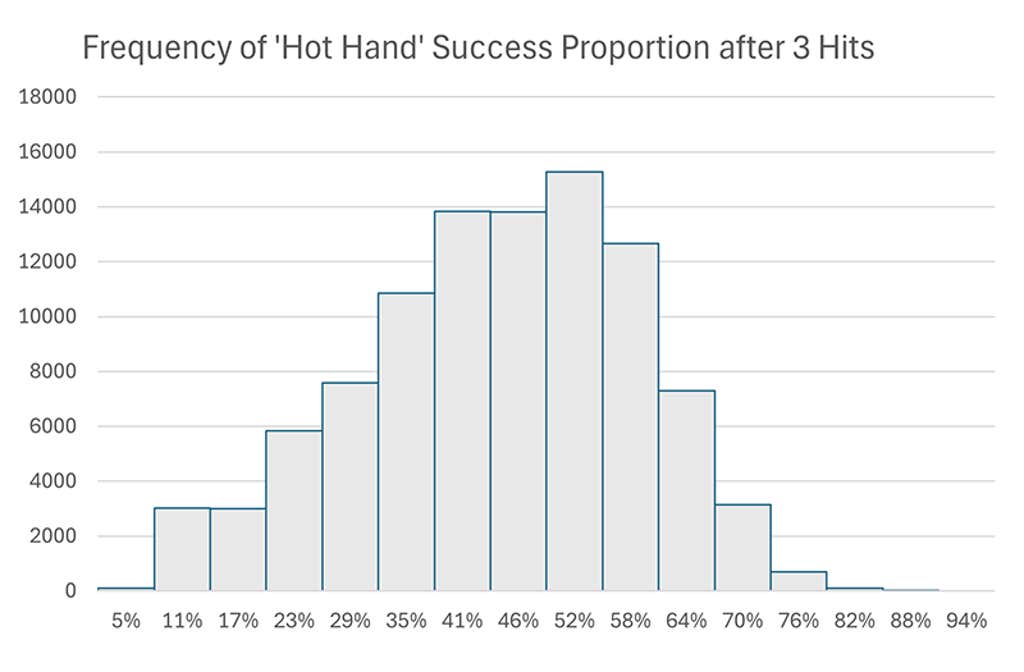
I’ll freely admit that I didn’t believe it either, at first. I only became convinced after I ran 100,000 simulations of 100 random coin flips and tabulated the proportions of heads following streaks of three heads. I knew the coin flips were perfectly random 50/50 processes under any conditions (coins don’t get “hot”). So, if I estimated the success rate at anything less than 50 percent, the bias was real. The overall average proportion of heads-after-three-heads I got was around 46 percent. The histogram (data visualization) of results clearly showed the negative bias. Without understanding the source of the bias, we might think the coin had the opposite of a hot hand. This was mechanically the same procedure as the original 1985 study, showing the study was flawed and its conclusions likely invalidated.
To see how this could possibly work, consider a simplified example of three coin flips. Suppose we want to determine if a coin coming up heads is more likely to be followed by another heads—to see if the coin can get “hot.” There are eight equally likely sequences of flips:
HHH
HHT
HTH
HTT
THH
THT
TTH
TTT
Out of these, the proportions of heads being followed by heads are as follows:
1
½
0
0
1
0
N/A
N/A
(We discard the last two cases because no coin flip came after a head.) Averaging the estimated proportions over the remaining six cases yields (1+½+1)/6 = 5/12, or about 42 percent. That is decidedly less than 50/50.
Even though we know the coin has no memory or “momentum,” estimating this way produces a number less than the true success probability in these situations, on average. As Miller and Sanjurjo demonstrated, this bias gets larger when you consider smaller samples and longer streaks. In the typical experiments like those in Gilovich, Vallone, and Tversky’s work, looking at streaks of two or three in samples of around 100, it could make a sizable difference.
Now, we might expect some strange things to crop up when we process the data the way I have described above. For one thing, we’re talking about an average proportion: the average over all the possible universes of the proportion of attempted shots that were successful after a streak of hits. Further, “average proportions” are notoriously finicky, especially when the proportions are being computed over different numbers of events, as they are here.
The numbers do not prove the hot hand is a figment of imagination.
In some sequences of coin flips in the table above, we had two cases to consider (such as the first and second ones) while in others there was only one. Compiling proportions taken over different sized sets is how we get famous examples of weird behavior like “Simpson’s Paradox,” in which a variable may trend one way among subsets of a larger group while the overall trend is the opposite.
For another thing, in our dataset of hits and misses, some of the streaks we might be considering necessarily overlap with each other. For example, if somewhere in the midst of 100 coin flips we had the sequence HHHHT, this would account for two streaks of three heads, one that’s followed by another heads and a second followed by tails. This means, in fact, that unless the segment we’re currently considering lasts until the very end of the data, there must at some point be a streak that ends in failure. The necessity of these failures contributes to the negative bias in our estimate of the rate of success.
Of course, real-world data is not like an idealized sequence of coin flips, and in a team sport like basketball, the picture is made messier thanks to confounding variables. This is due to an overall lack of available data from real games, and the fact that, often, when a player gets hot, defenses will change their strategy to compensate.
What’s more, a player on a shooting streak, who may have a hot hand or not (some streaks are just luck), may take greater risks, such as attempting more difficult shots, known colloquially as “heat checks.” If these attempts result in misses, then a look at just the data would suggest the player was never hot. Some players may get nervous after a few successes because they feel all eyes are on them, whereas for others the pressure of a big game or a cheering crowd may be integral to the emergence of a hot hand. Controlled experiments where the strategic factors are held fixed but the psychological environment is preserved are hard to come by.
That’s why Miller and Sanjurjo claim perhaps the strongest evidence for the hot hand effect is in the three-point shooting contest, held during the NBA’s All-Star weekend festivities; there’s no defense and the shot locations are fixed. Players have 70 seconds to shoot up to 27 balls. Performances like Craig Hodges hitting 19 shots in a row in 1991 seem like clear examples of a hot hand at work. (Curry has won the contest twice.) From there, Miller said, it’s reasonable to extrapolate to in-game settings, and “then you can couple that with what the players themselves say.” Or do. “This guy shot the basketball and started walking the other way,” commentator Mark Jackson once remarked during a game after Dwyane Wade, the former Miami Heat star, launched a three-pointer with such confidence that he didn’t bother to watch it go in. “That’s called being in the zone.”
The saga of the hot hand effect offers at least one final cautionary tale.
However, there’s the crux of the issue: Should we trust people’s subjective experiences of what it’s like to be “in the zone,” or should we assume there’s no such thing until it shows up in the data? Cognitive biases, such as finding patterns where none exist, are certainly real, and people’s ability to discern the presence of randomness is notoriously bad. Go to any casino and watch at the roulette table as people try to spot streaks in the most recent spins or look online for advice about tradeable “signals” in the movements of stock prices. But shouldn’t years of testimony from high-performing athletes like Curry count for something?
The claim that the hot hand is an illusion is equivalent to saying players’ skill levels are perfectly constant through time. Compared to the hot hand effect, this is arguably the bolder statement in need of evidentiary support. Many human activities—from sports to literature to theoretical physics—involve some combination of skill and luck to create success. But it’s misleading to think of the “luck” component of that mix as truly “random.”
Instead, it’s perhaps better described as uncontrollable by the person involved in performing the action—the tiny fluctuations in the conditions of the ball, fingers, arms, feet—the unaccounted-for variations and moments of inspiration that are beyond the skill level of that particular player to reliably dictate at that particular moment.
But who’s to say the boundary between controllable and uncontrollable can’t shift? The relative shares of “luck” vs. “skill” could be dependent on many situational factors. Players might reliably be able to sense when finer details that are normally beyond their control are suddenly within their grasp. That’s “the zone.”
The saga of the hot hand effect offers at least one final cautionary tale about the enduring power of random phenomena to fool us all (myself included), even—maybe especially—when we think we’re unfoolable. The counterintuitive properties of streaks in random sequences tricked the original researchers into overlooking a pattern that was really there in the data. The percentage of successes under their method of selecting candidate shots included a bias that erased the effect of the hot hand to boost the success rate.
But by simulating synthetic data under known assumptions and verifying that their methods retrieved the right answers, they might have protected themselves against the illusions of probability. Tversky, after publishing his research and becoming one of the most outspoken critics of the hot hand, once said as much: “It may be that the only way you can learn about randomness is to toss coins on the side while you play.” During the NBA Finals this week between the Celtics and Mavericks, if you happen to notice any players on the bench compiling histograms of coin tosses, they might just be trying to understand whether it’s statistically valid to conclude their teammates are heating up.
Lead photo: Boston Celtics center Kristaps Porzingis shoots over Dallas Mavericks guard Luka Doncic during Game 1 of the 2024 NBA Finals. (AP Photo/Charles Krupa)
An estimated 100 billion stars make up the Milky Way. Our home galaxy stretches 100,000 light-years across, an astounding size that can be difficult to fathom until you sit outside on a dark night, look up, and are hit with the sight of a brushstroke of stars and space dust splashed against the sky.
Each year, the Milky Way Photographer of the Year awards honor the photographers who capture the beauty of our galaxy from down here on Earth. Capture the Atlas selected 25 winners from more than 5,000 entries submitted from around the world. The final list includes photographs shot in 19 different countries, including Australia, New Zealand, Chile, Argentina, France, Switzerland, Spain, Italy, Bulgaria, Slovenia, Egypt, Oman, Yemen, Jordan and the United States.
Photographer Tom Rae said of his photo, snapped against the backdrop of New Zealand’s highest mountain: “It embodies the dedication, sleepless nights, and the fulfillment of completing my vision. The image features icebergs in the cyan-blue glacial lake, red airglow painting the sky, and the glow of billions of stars in the Milky Way—a glimpse into the vastness beyond.”
“Lightning Lake” Location: Aoraki, Mount Cook National Park, New Zealand
The Milky Way emerges from New Zealand’s highest mountain, Aoraki/Mount Cook, on a winter night—a shot I’ve longed to capture, knowing it would encapsulate the mountains and sky elements perfectly. In rare alpine weather conditions, I embarked on a journey up the glacial valley one night. Upon reaching the lake, the scene that unfolded made me feel like I had landed on another planet. This night, among many spent documenting this incredible part of the world, stands out for me.
It embodies the dedication, sleepless nights, and the fulfillment of completing my vision. The image features icebergs in the cyan-blue glacial lake, red airglow painting the sky, and the glow of billions of stars in the Milky Way—a glimpse into the vastness beyond. Image: Tom Rae
“Starry Hoodoo Wonderland” Location: Kanab, Utah, USA
This photograph represents the camaraderie within the night photography community. During the Nightscaper Photo Conference in Kanab, Utah, I had the opportunity to meet fellow photographers, many for the first time, and reconnect with others from afar. In this group, I found my people—those passionate about photography, star therapy, astronomy, and the beauty of dark skies.
Many of these individuals have become friends. Additionally, this trip marked my first encounter with hoodoos. Visiting the Toadstool Hoodoos with a group, I focused on enjoying the experience and fellowship rather than solely capturing the perfect shot.
However, I returned the following night to capture a blue hour foreground shot, aiming to replicate the scene from the previous night. Sharing this photograph and being recognized among such talented photographers is a privilege. Image: Stephanie Thi
“Milky Way at Morning Glory Pool” Location: Yellowstone National Park, USA Morning Glory is a renowned hot spring within Yellowstone National Park, shaped by hydrothermal features that foster vibrant habitats for microscopic organisms. Originally azure blue like the famous Grand Prismatic Spring, human interference and pollution have turned its waters a striking green. Unlike other springs, Morning Glory remains calm, enabling the reflection of starlight at night.
In this photo, the pool mirrors Scorpius, notably Antares, against a clear dark sky and brilliant Milky Way. The high elevation and minimal light pollution enhance the celestial spectacle. On a warm summer night, I finished this photo with one hand, and with the other hand tightly gripping bear spray! But despite the fear of wildlife, it was a very enjoyable night spent alone with the stars all around. Image: Jerry Zhang
“Rainbow Valley” Location: Rainbow Valley Conservation Reserve, Northern Territory – Australia
My recent journey to the Central Australian Outback was an incredible experience, exposing me to the harsh vastness of the outback and some of the darkest southern night skies in the world. This image captures the breathtaking scene at Rainbow Valley Conservation Reserve, where the southern Milky Way gracefully spans above a remarkable formation of colorful sandstone rocks. This area exudes a unique charm, with its vibrant hues and stunning geological formations creating a mesmerizing landscape. Image: Baillie Farley
“Mother Juniper” Location: Jebel Shams, Oman
The wisdom of the juniper reveals itself in its aged roots, twisted and sculpted over millennia, enduring the ravages of time and countless obstacles. Amidst the ever-changing tides of time, one constant remains: its profound connection with the night sky and the Milky Way. Their paths intertwine and converge, culminating in a perfect alignment. In that fated instance, I found myself beneath the juniper’s boughs, gazing up at the cosmic dance above, capturing its essence in the stillness of the night. Image: Benjamin Barakat
“The vanity of life” Location: Wadi Rum Desert, Jordan
The concept behind this shot is to highlight the stark contrast between the vastness of the cosmos and the minuscule nature of humanity. The composition intentionally draws the viewer’s focus to a small figure, underscoring our insignificance in the grand scheme of the universe, while the majestic Milky Way core dominates the background.
Whenever I venture out to capture the night sky, I’m filled with a sense of humility and gratitude for my existence. It’s as if my problems diminish in comparison, and I’m reminded of the immense love I have for my family and the beauty of life itself, making everything else seem trivial. Image: Mihail Minkov
“Saoseo” Location: Graubuenden, Switzerland
This lake is one of Switzerland’s most beautiful, renowned for its striking blue color, perfect for Milky Way photography from late July. My original plan was a split shoot with an underwater housing and model Marina, but the housing broke on the first try. Fortunately, the lake offered other beautiful compositions. Situated at 2000m altitude, it gets very cold after sunset; we had forgotten our jackets in the car 1.5 hours away.
To keep warm, we walked around the lake while waiting for the Milky Way. Clouds came and went, threatening to obscure the stars, but luck was on our side. I had a clear view of the Milky Way for just 30 minutes before it vanished behind clouds again. I created two versions of this photo: a landscape version and one with Marina, available on my Instagram. Image: Alexander Forst
“Bluff Hut” Location: Mungo River Valley, West Coast, New Zealand
Sometimes, the best images come completely unplanned, which is precisely what happened on this trip to Bluff Hut, nestled in the Southern Alps on New Zealand’s South Island.
Only accessible by a challenging hike or helicopter flight, I had no intention of ending up here, as I had a different shoot planned at another hut. However, with weather closing in at my intended location and no backup plan, I trusted the chopper pilot to choose the best spot for clear skies that evening. Thankfully, he didn’t disappoint, and I was able to capture the Milky Way arching majestically over the hut from one of the darkest places on the planet. Image: Rachel Roberts
“Atmospheric fireworks” Location: Dordogne, France
Last winter, I ventured to the foot of a medieval castle in France to capture the Milky Way’s “winter” arc. Alongside the stunning celestial vault, an exceptional airglow illuminated the sky, resembling multicolored clouds. This natural phenomenon occurs due to a chemical reaction in the upper atmosphere, emitting faint light known as chemiluminescence.
The panoramic view spans 180°, showcasing the entire Milky Way arc. From left to right: Sirius and the constellation of Orion, Mars, the Pleiades, the California Nebula, Cassiopeia, the double cluster of Perseus, and the Andromeda galaxy. Capturing this image required a large panorama of 40 exposures, totaling nearly an hour of exposure time using my Canon 6D Astrodon and Sigma 28mm f/1.4 lens. Image: Julien Looten
Publisher’s note Springer Nature remains neutral with regard to jurisdictional claims in published maps and institutional affiliations.
This is a summary of: Lu, Z. et al. Long-term intravital subcellular imaging with confocal scanning light-field microscopy. Nat. Biotechnol. https://doi.org/10.1038/s41587-024-02249-5 (2024).


:focal(800x602:801x603)/https://tf-cmsv2-smithsonianmag-media.s3.amazonaws.com/filer_public/8f/51/8f512b61-8f6d-4522-b705-649c5a075ff4/1_zahn_nahaufnahme_web.jpg?w=1000&resize=1000,750&ssl=1 "Do These Fossilized Teeth Belong to the World’s Smallest Great Ape?")
:focal(800x602:801x603)/https://tf-cmsv2-smithsonianmag-media.s3.amazonaws.com/filer_public/8f/51/8f512b61-8f6d-4522-b705-649c5a075ff4/1_zahn_nahaufnahme_web.jpg "Do These Fossilized Teeth Belong to the World’s Smallest Great Ape?")
/https://tf-cmsv2-smithsonianmag-media.s3.amazonaws.com/filer_public/dd/3a/dd3a7283-fa5c-4361-ab05-80ba4b9adf49/6_madelaine_boehme_web.jpg)
/https://tf-cmsv2-smithsonianmag-media.s3.amazonaws.com/filer_public/e6/33/e6337d5d-d969-4cd6-83ca-14ab3e3c6c6a/4_zaehne_3d-druck_web.jpg)